基于K8S环境的 JVM数据抓取汇总
做为Java程序开发,平时性能调优最重要的就是要看下JVM内存的占用情况和回收情况来预估程序的问题或者GC、内存的调优。平时我们会使用jmap、jstat、jstack等来看来堆、栈和GC的情况。在小项目中机器不多的情况还好进行观察,随着容器化和微服务概念的普及,需要操作的实例越来越多传统的方案越来越繁琐。今天我们来尝试搞一套基于K8s体系下的 jmx_exporter【jvm数据暴露】 + prometheus【数据抓取】 + grafana【数据展示】。
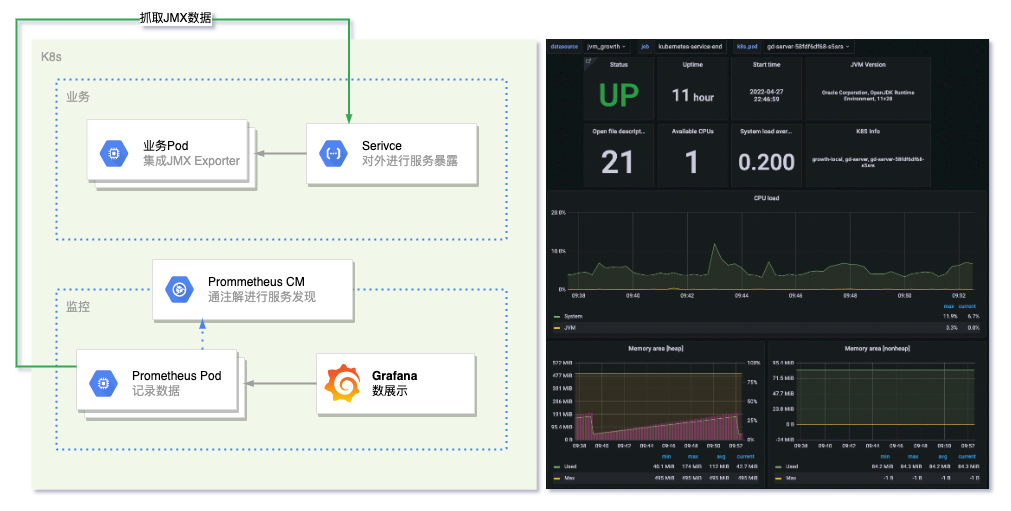
初步设想架构如下
基础镜像准备
将jmx_exporter启用有几种方案,1. 直接打入基础镜像。2. 放入k8s存储中通过k8s进行挂载。这里我们以第一种方案来尝试,并以openjdk11为基础镜像
FROM openjdk:11

COPY jmx_config.yaml /opt/tools/jmx_config.yaml

RUN mkdir /opt/tools && \
    curl -o /opt/tools/arthas-boot.jar https://arthas.aliyun.com/arthas-boot.jar && \
    curl -o /opt/tools/jmx_prometheus_javaagent-0.16.1.jar https://repo1.maven.org/maven2/io/prometheus/jmx/jmx_prometheus_javaagent/0.16.1/jmx_prometheus_javaagent-0.16.1.jar
把上述dockerfile打包成基础镜像并发布到内部服务器,如果咱们的基础镜像叫 openjdk:jmx-11 在实际项目中直接FROM这个名字即可
生成业务的k8s脚本
apiVersion: v1
kind: Service
metadata:
  name: demo-server
  namespace: demo-local
  labels:
    app: demo-server
  annotations:
    # 此注解未来给 prometheus 发现服务使用
    # 标记是否使用 prometheus 进行抓取
    prometheus.io/scraped: "true"
    # 标记要抓取的端口
    prometheus.io/scrape_port: "9001"
spec:
  ports:
    # 业务本身暴露的端口
    - name: http
      port: 8081
    # jmx暴露的端口
    - name: jmx
      port: 9001
  selector:
    app: demo-server
  type: ClusterIP
---
apiVersion: apps/v1
kind: Deployment
metadata:
  name: demo-server
  namespace: demo-local
spec:
  selector:
    matchLabels:
      app: demo-server
  replicas: 2
  template:
    metadata:
      labels:
        app: demo-server
    spec:
      containers:
        - name: demo-server
          image: demo/demo-server:image-version
        #   修改 java的启动参数,增加 javaagent并指定暴露的端口
          command:  ["java","-javaagent:/opt/tools/jmx_prometheus_javaagent-0.16.1.jar=9001:/opt/tools/jmx_config.yaml","-jar","/data/program.jar"]
          env:
            - name: NODE
              valueFrom:
                fieldRef:
                  fieldPath: spec.nodeName
            - name: NAMESPACE
              valueFrom:
                fieldRef:
                  fieldPath: metadata.namespace
          ports:
            - containerPort: 8081
尝试下暴露的JMX数据情况
$ curl demo-server.demo-local:9001
# HELP jmx_config_reload_success_total Number of times configuration have successfully been reloaded.
# TYPE jmx_config_reload_success_total counter
jmx_config_reload_success_total 0.0
# HELP jvm_memory_pool_allocated_bytes_total Total bytes allocated in a given JVM memory pool. Only updated after GC, not continuously.
# TYPE jvm_memory_pool_allocated_bytes_total counter
jvm_memory_pool_allocated_bytes_total{pool="Eden Space",} 2.8827097896E10
...
更多关于 jmx_exporter 请查看官网
准备Prometheus
我们打算把整个监控放到单独的名称空间,首先创建名称空间,然后创建相应的服务账号和角色
# 准备新的名称空间
apiVersion: v1
kind: Namespace
metadata:
  name: monitoring
---
# 创建一个服务账号
apiVersion: v1
kind: ServiceAccount
metadata:
  name: prometheus
  namespace: monitoring
---
# 创建一个角色
apiVersion: rbac.authorization.k8s.io/v1
kind: ClusterRole
metadata:
  name: prometheus
rules:
- apiGroups: [""]
  resources:
  - nodes
  - services
  - endpoints
  - pods
  verbs: ["get", "list", "watch"]
- apiGroups: [""]
  resources:
  - configmaps
  verbs: ["get"]
- nonResourceURLs: ["/metrics"]
  verbs: ["get"]
---
# 绑定账号和角色
apiVersion: rbac.authorization.k8s.io/v1
kind: ClusterRoleBinding
metadata:
  name: prometheus
roleRef:
  apiGroup: rbac.authorization.k8s.io
  kind: ClusterRole
  name: prometheus
subjects:
- kind: ServiceAccount
  name: prometheus
  namespace: monitoring
准备好基础后我们开始准备Prometheus的配置文件,因为会频繁的修改该文件,我们将配置项目放入k8s的configmap中。关于配置的更多细节同样要参考官网
apiVersion: v1
kind: ConfigMap
metadata:
  name: prometheus-config
  namespace: monitoring
data:
  default: |
    global:
      scrape_interval:     10s
      evaluation_interval: 15s
    scrape_configs:
      - job_name: 'kubernetes-service-endpoints'
        kubernetes_sd_configs:
        - role: endpoints
        relabel_configs:
        # 指定一下我们只抓取9001端口
        - source_labels: [__address__, __meta_kubernetes_service_annotation_prometheus_io_scrape_port]
          action: replace
          regex: ([^:]+)(?::\d+)?;(\d+)
          replacement: $1:$2
          target_label: __address__
        #  指定只抓取含有prometheus_io_scraped注解,切状态为true的
        - source_labels: [__meta_kubernetes_service_annotation_prometheus_io_scraped]
          action: keep
          regex: true
        - action: labelmap
          regex: __meta_kubernetes_pod_label_(.+)
        # 指定一些label方便我们在grafana中进行展示和数据区分
        - source_labels: [__meta_kubernetes_namespace]
          action: replace
          target_label: k8s_namespace
        - source_labels: [__meta_kubernetes_node_name]
          action: replace
          target_label: k8s_node
        - source_labels: [__meta_kubernetes_service_name]
          action: replace
          target_label: k8s_service
        - source_labels: [__meta_kubernetes_pod_name]
          separator: ;
          regex: (.*)
          replacement: $1
          target_label: k8s_pod
          action: replace
接下来准备部署Prometheus的servcie和pod。
apiVersion: apps/v1
kind: Deployment
metadata:
  name: prometheus
  namespace: monitoring
  labels:
    app: prometheus
spec:
  replicas: 1
  revisionHistoryLimit: 2
  selector:
    matchLabels:
      app: prometheus
  minReadySeconds: 0
  strategy:
    type: RollingUpdate
    rollingUpdate:
      maxUnavailable: 1
      maxSurge: 1
  template:
    metadata:
      labels:
        app: prometheus
    spec:
      serviceAccountName: prometheus
      containers:
        - name: prometheus
          image: prom/prometheus
          imagePullPolicy: IfNotPresent
          readinessProbe:
            httpGet:
              path: /-/ready
              port: 9090
            initialDelaySeconds: 60
            periodSeconds: 10
          livenessProbe:
            httpGet:
              path: /-/healthy
              port: 9090
            initialDelaySeconds: 60
            periodSeconds: 10
          ports:
            - containerPort: 80
          volumeMounts:
          - name: config
            mountPath: /etc/prometheus/prometheus.yml
            subPath: default

      volumes:
        - name: config
          configMap:
            name: prometheus-config
---
apiVersion: v1
kind: Service
metadata:
  name: prometheus
  namespace: monitoring
spec:
  selector:
    app: prometheus
  type: NodePort
  ports:
  - protocol: TCP
    port: 9090
    targetPort: 9090
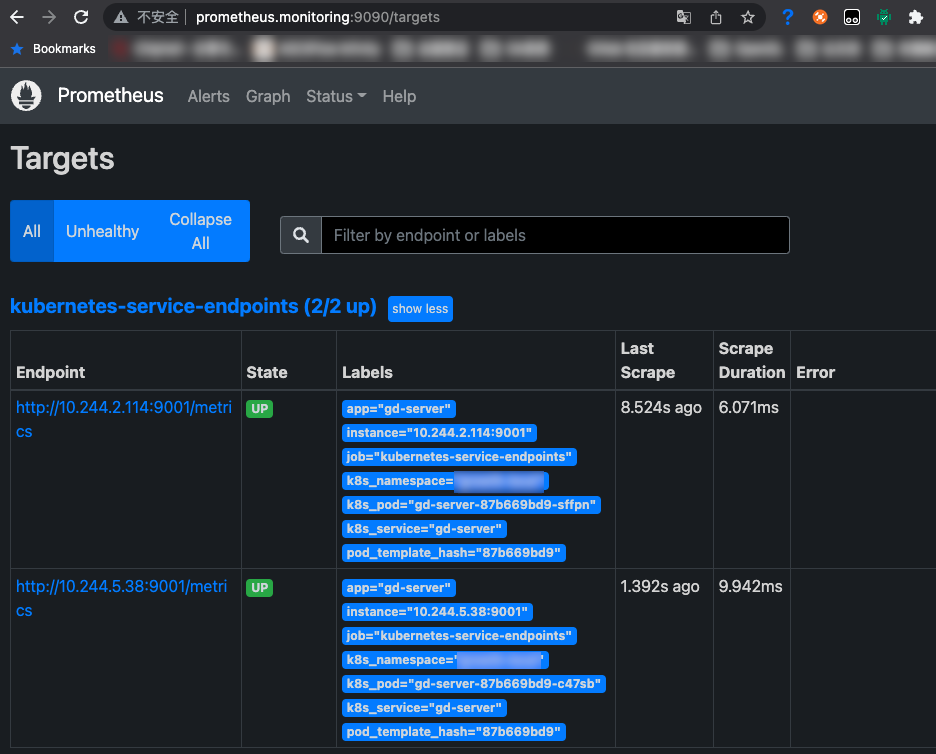
都创建好后,直接在浏览器打开我们的 prometheus 站点看看效果 open http://prometheus.monitoring:9090 切到 Status->Targets下,能看到已经被捕获的两个POD节点
最后一步准备 Granfan
仍然先是部署 Deployment和Service
apiVersion: apps/v1
kind: Deployment
metadata:
  name: grafana
  namespace: monitoring
  labels:
    app: grafana
spec:
  replicas: 1
  revisionHistoryLimit: 2
  selector:
    matchLabels:
      app: grafana
  minReadySeconds: 0
  strategy:
    type: RollingUpdate
    rollingUpdate:
      maxUnavailable: 1
      maxSurge: 1
  template:
    metadata:
      labels:
        app: grafana
    spec:
      containers:
        - name: grafana
          image: grafana/grafana
          imagePullPolicy: IfNotPresent
          readinessProbe:
            httpGet:
              path: /api/health
              port: 3000
            initialDelaySeconds: 60
            periodSeconds: 10
          livenessProbe:
            tcpSocket:
              port: 3000
            initialDelaySeconds: 60
            periodSeconds: 10
          ports:
            - containerPort: 3000
---
apiVersion: v1
kind: Service
metadata:
  name: grafana
  namespace: monitoring
spec:
  selector:
    app: grafana
  type: NodePort
  ports:
  - protocol: TCP
    port: 3000
    targetPort: 3000
- 部署后我们使用浏览器打开 open http://grafana.monitoring:3000
- 然后增加我们的数据源,数据源的地址为上一步时的暴露服务 http://prometheus.monitoring:9090
- 增加Dashboards看板。不想自己做看板的,也可以直接通过 ID号 16193直接进行导入
如果觉得文章内容比较实用,期望获得更新通知,请关注公众号: